


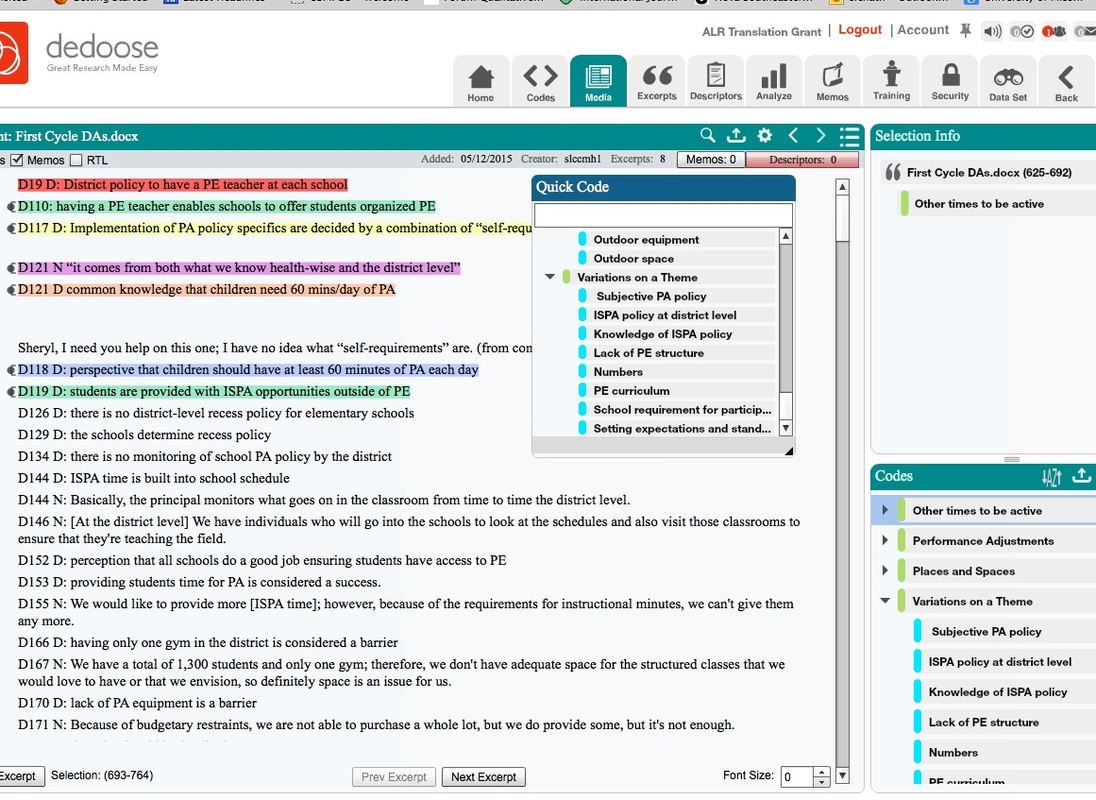
 I am gradually making some adjustments to my coding style to work optimally with the web-based Dedoose program. By the way, in comparison with my prior experiences with NVivo, Hyperresearch (the trial version), Transana, and MS Word, I have concluded that Dedoose has the edge over the others at this point in time, largely due to the very convenient project sharing capability. I am still doing first cycle coding in Word in essence to create a reduced and focused body of data that remains close to the original. For the project depicted above, the coders used descriptive and in vivo codes; these have become my default coding schemes. While doing some of the second cycle coding, I started to consider similarities between my second cycle coding process and statistical model building. We started with lots of first cycle codes - pages and pages - that we uploaded into Dedoose and treated as excerpts. We made a very large number of categories or second cycle codes - well more than 100. (This reminded me of the people who post on some of the qualitative listservs about having hundreds of themes.) However, I believe the very nature of a theme prevents the occurrence of hundreds or even dozens in most projects; a theme in my opinion should be relatively broad.
I started to cluster the codes and actually went back to my default work style with Word. I learned quickly enough (well, not quite quickly enough because I eliminated many first cycle codes through 'merging' in Dedoose) that I could drag the codes and drop into another to create a parent/child/grandchild, etc. hierarchy. After going through this process, I was left with about a dozen categories, most of which had child or subcategories. However, there was one set of first cycle codes left that needed to be placed into the second cycle categories. It was in doing these that I was struck by how well the excerpts seem to match in one of the existing dozen (actually 13) categories. This led me to question whether the patterns really are there or whether I am just more likely to see patterns. This thought process led me to the idea of statistical (regression) model building, which I lectured on just a few weeks ago. I was cautioning my students about order of entry of variables because the earliest entered variables will 'gobble up' as much of the variance as possible, even when there is substantial covariance with other variables. This can create the illusion of greater importance. So obviously with these excerpts, I am first looking over my reduced code list for a match - before creating something new - and when there is a match, I'm assigning that category. But what about covariance? Am I missing some of it? On the other hand, my practical nature argues for parsimony (as did one of my favorite statistics professors, and as did Creswell in his "Five Approaches" book (Sage Pubs), and to retain the focus on data reduction. Additionally, I have had some experiences with order of entry in regression and in some cases the difference is there but is minimal; it seems like the themes that run through things float to the top one way or another.
0 Comments
Leave a Reply. |
AuthorI am Sheryl L. Chatfield, Ph.D, C.T.R.S. I am a member of the faculty in the College of Public Health at Kent State University. I also Co-coordinate the Graduate Certificate in Qualitative Research and I am a member of the Design Innovation Team at Kent State. Archives
February 2024
Categories
|
 RSS Feed