|
I wrote months about about my plans to work through a project - start to finish - in Dedoose. That project ended up being put 'on hold' but I did code many open response items from a survey in Dedoose, and very recently restarted on some old work.
A program like this is pretty well unbeatable for something like a survey with one or a few open response items - especially when a lot of brief excerpts cover moderately to highly repetitive subject matter (aha - saturation! - see previous post). In the instance of this open response item, I did a lot of counting (actually Dedoose did a lot of counting) and managed to find only a small number of unique responses. I began with a nearly complete a priori code list (the open responses were very similar to the choices given on the fixed response portion of the survey). The few codes I added included a combination item (called 'multiple factors working together') and a code that was so primary in the process the research team was exploring that it was not even contemplated for the survey. That in itself is interesting and meaningful but is a story for another day. Maybe the greatest advantage of working through the open response items was that it increased my comfort with Dedoose a great deal. I still have some problems in (physically) capturing more 'data' in a code than I'd like (usually I get extra empty space, not extra words), and it does not 'quick code' exactly the same way as NVivo - that I have used quite a bit more - but I still think the project sharing feature of this web-based software elevates it miles above the alternatives. It is also pretty cost effective. I'm still not using Dedoose (or any CAQDAS) for inductive/open first cycle coding due to the length and number of codes I create at that stage. I am doing second cycle - of the first cycle codes - and I think I'll end up working both up (combining second cycle to categories) and down (creating some lower level codes out of the second cycle codes) after this stage is over. The bottom line, I think, is that we all need to find a way to make the software work with our process, rather than the other way around. I continue to be concerned when new researchers are trained on software first, analysis, design, etc. later if at all - and this applies to quan as well as qual. Visit and learn about Dedoose
1 Comment
While in the process of working through some coding, it occurred to me that one peril of using saturation to determine when you are 'done' coding, is that you will hit that point fairly quickly when your data are repetitive. So if you are working with a fairly straightforward or structured interview guide, or happen by bad luck to interview several consecutive people who are not particularly talky, you could honestly describe and evidence saturation but still be missing a lot of relevant information.  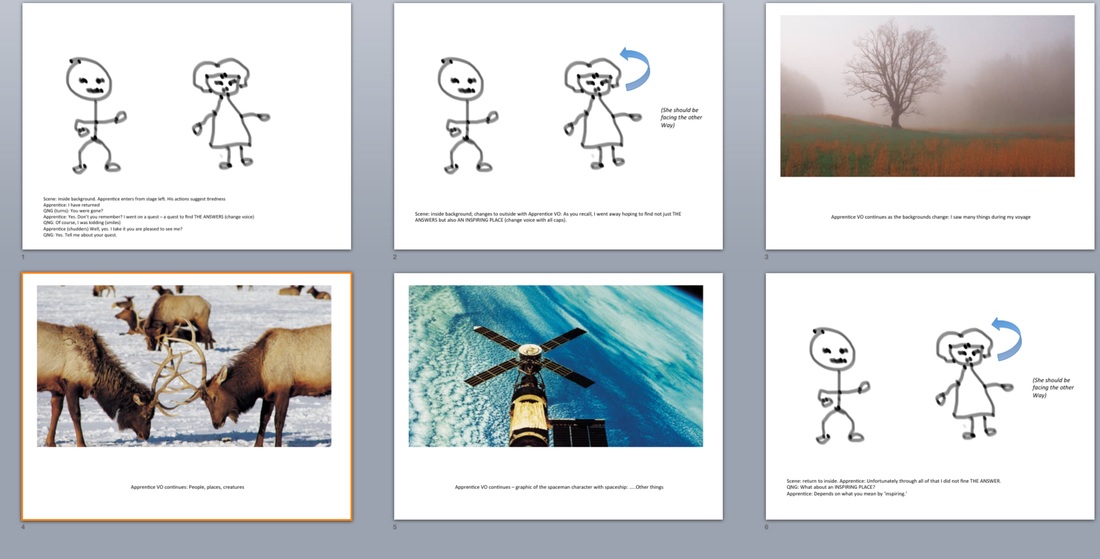 I used the PowerPoint slide sorter to create this graphic. The photo images came from included clip art although I created the stick person renderings of the Apprentice and Qualitative Ninja Girl - the main characters in the short animations contained on the other pages of this blog site (see the tabs above).
That was actually a several-step process; I have an older Wacom Bamboo tablet and stylus so had to find the driver (Wacom has legacy drivers on their website), then needed some drawing software (I chose Sketchbook - free at the app store), had to make my stock images (I might consider making more, in various poses, or just keep adding the stage directions as done here), used Grab to save those as TIFF, then converted to JPEG and inserted into the PowerPoint. I could have used the TIFFs but Weebly requires JPEG so I have gotten in the habit of keeping image files as JGEP. My template slide is the content plus title with content on the top and title on the bottom. I decreased the font size to use this for both dialog and stage directions. My purpose for doing this is both to improve my efficiency at making new animations and to try out this graphic-based process for research design planning. The biggest problem I think is going to be a need to have more available graphics. I have a start with some scanned photos but really have not built this up yet the way I would like. I will see how far I can go with some simple drawings and the standard clip art files. I have rarely made animations since GoAnimate changed the templates. It was easy to quickly type in some dialogue with standard backgrounds and limited action choices.
This is not the ideal way to work and does not take advantage of the rich alternatives available. In fact, it is sort of like limiting oneself to survey research - using one of 2 or 3 different surveys. Richer designs might yield richer results both in animation and surveys. Even my minor efforts in animation are likely to benefit from an improved planning process. Since I'm trying to think in more than one component (dialogue + action), I think a storyboard rather than a simple script, is the way to go. So my plan for ensuing posts is to describe my storyboarding efforts for the next episode of Qualitative Ninja Girl. Then I am going to experiment with applying the same process to simple research design. My first candidate is the Microsoft Office program Power Point. I am going to use the slide sorter view. I'll also look at Mac's IWork presentation software Keynote. And then I will explore Prezi - which has always seemed like a neat idea but rarely works well for me.  It's been awhile and last year was rough. The summer was full of transitions - new job, new home, new state, new places to do things, etc. I have been working on some conference submission abstracts and noted a trend - perhaps more prevalent in health research than in the general social sciences - toward assuming that everything is going to be experimental and expressed quantitatively. In fact, I am still puzzling through how to submit a qualitative exploratory research abstract for one such opportunity, given that everything about the description presumed quan/stats. Hence my title - inspired by a clip of the new Muppet show in which Fozzie bear accuses some people of 'specism' or the like. I hope I am not a quantist myself. Unfortunately, as demonstrated by the two photos of books separately shelved in my office, I am at least guilty of segregating my qual and quan methods books. 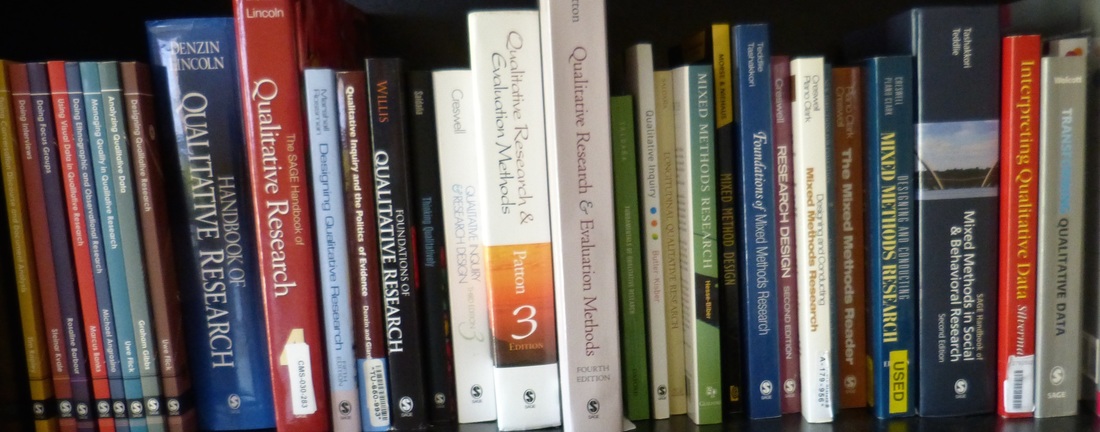 (Note that I have placed the mixed books with the qual books - suggesting perhaps that I consider qual the more flexible, accepting, tolerant method.)
|
AuthorI am Sheryl L. Chatfield, Ph.D, C.T.R.S. I am a member of the faculty in the College of Public Health at Kent State University. I also Co-coordinate the Graduate Certificate in Qualitative Research and I am a member of the Design Innovation Team at Kent State. Archives
February 2024
Categories
|
 RSS Feed