


|
I spend some time traveling earlier this week. Actually I spent a lot more time traveling than I planned due to bad weather conditions impacting flights coming into and going out of the Charlotte, NC airport. By the way, I would like to acknowledge the women who work in the Charlotte airport restrooms as among the friendliest people I've ever encountered in any airport; in fact, as a group, they are the friendliest people I've ever encountered working in any ladies' restroom. The photo is actually from a February trip to Akron taken through the window of the Cleveland airport. I think it was about 10 degrees that day. 
0 Comments
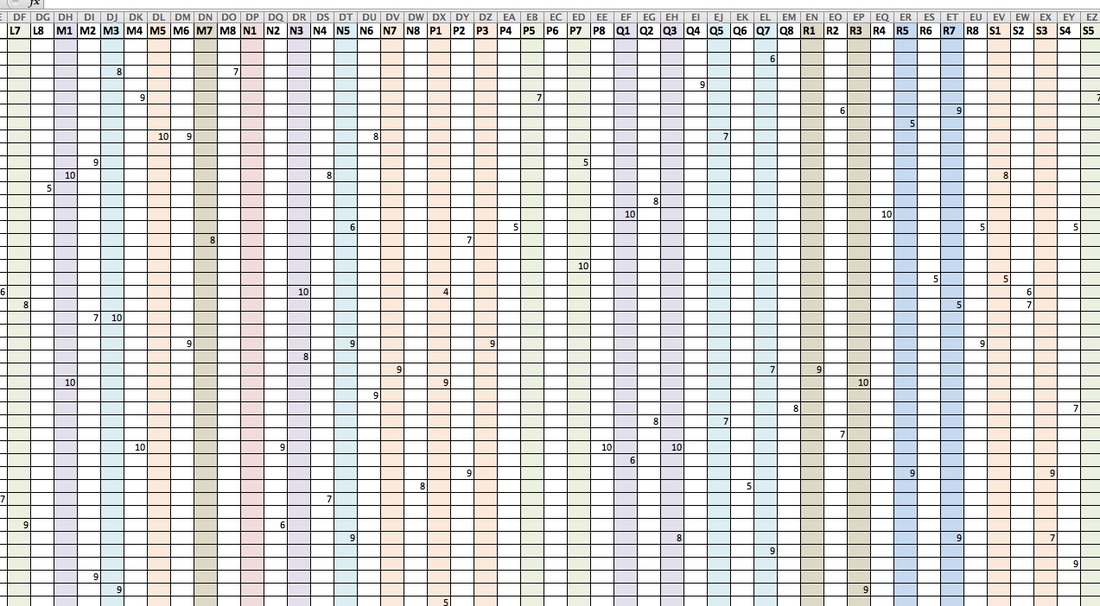 I literally spent the weekend entering scores from an online survey - and yes, there were more than 3400 although I do not yet know the exact number. This is a screenshot that shows some of the middle section of the data frame - columns were labeled by letter and number, from 1 to 8 (A1: A8; B1: B8, etc.). I did not use I or O and finished with AA. There were 440 + rows. I used shading and borders to help separate the scores, and froze the top row so I could tab down. After a slow few hours, I realized that I could sort the columns by scores (most of the spaces are empty because each person only scored a random sample of items) and started doing that in batches of 4 so I only had to look at the upper portion of the data. This made my progress a lot easier. Today, I sorted in 8s - which worked pretty well - and moved through it even faster. I made several errors that I am aware of and have plans to spot check about 10%.
I am working on a Screenflow video that shows all of the organization and reorganization I did with the raw Qualtrics report data to make it possible to do this entry as efficiently as possible. Qualtrics did provide good summary information and if I was not doing a multilevel analysis with person as level 1, the Qualtrics summary would have been ample. Unfortunately for me, it was not the case. I'm not quite finished; I still need to put 21 sheets in a workbook together to make one long data frame that can be sorted by participant number. Whew!   I created an account in Google Scholar some time ago because someone recommended that I do this. I've noticed recently that Scholar, like Amazon or Ebay, is trying to figure out what I want or like. My favorite Amazon recommendation, by the way, and one worth repeating since I likely mentioned in in a prior blog post, was this: "Sign up to receive an alert when Pliny the Elder publishes any new works." This, of course, is not particularly likely since he died in AD 79 during the volcanic eruption of Mt Vesuvius. Even Pliny the Younger (61-113) has been gone a long time now.
In some instances, the recommendations from Scholar are right on target - I was alerted to a newly published work that compared accelerometer validation with self-reported exercise participation (Evenson et al., 2015, doi: 10/1186/s12966-015-0183-7) that is of great interest to me. Other times, the relationship between the recommendations and my actual interests is tenuous at best, and reminds me of my AC/DC music channel on Pandora. |
AuthorI am Sheryl L. Chatfield, Ph.D, C.T.R.S. I am a member of the faculty in the College of Public Health at Kent State University. I also Co-coordinate the Graduate Certificate in Qualitative Research and I am a member of the Design Innovation Team at Kent State. Archives
February 2024
Categories
|
 RSS Feed