


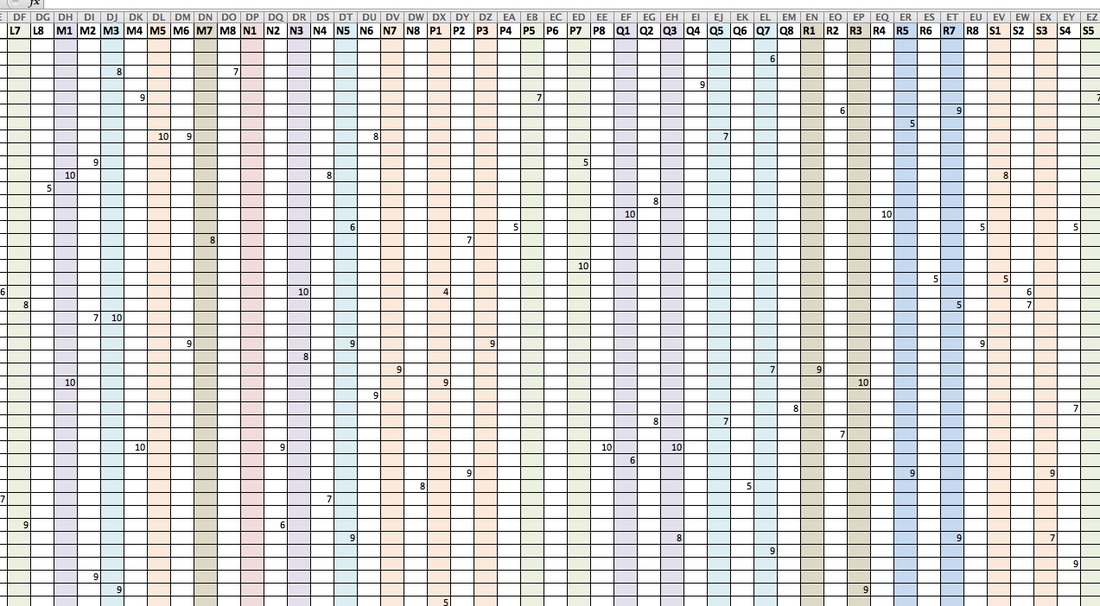
 I literally spent the weekend entering scores from an online survey - and yes, there were more than 3400 although I do not yet know the exact number. This is a screenshot that shows some of the middle section of the data frame - columns were labeled by letter and number, from 1 to 8 (A1: A8; B1: B8, etc.). I did not use I or O and finished with AA. There were 440 + rows. I used shading and borders to help separate the scores, and froze the top row so I could tab down. After a slow few hours, I realized that I could sort the columns by scores (most of the spaces are empty because each person only scored a random sample of items) and started doing that in batches of 4 so I only had to look at the upper portion of the data. This made my progress a lot easier. Today, I sorted in 8s - which worked pretty well - and moved through it even faster. I made several errors that I am aware of and have plans to spot check about 10%.
I am working on a Screenflow video that shows all of the organization and reorganization I did with the raw Qualtrics report data to make it possible to do this entry as efficiently as possible. Qualtrics did provide good summary information and if I was not doing a multilevel analysis with person as level 1, the Qualtrics summary would have been ample. Unfortunately for me, it was not the case. I'm not quite finished; I still need to put 21 sheets in a workbook together to make one long data frame that can be sorted by participant number. Whew!
0 Comments
Leave a Reply. |
AuthorI am Sheryl L. Chatfield, Ph.D, C.T.R.S. I am a member of the faculty in the College of Public Health at Kent State University. I also Co-coordinate the Graduate Certificate in Qualitative Research and I am a member of the Design Innovation Team at Kent State. Archives
February 2024
Categories
|
 RSS Feed